About the study
- Title (bibliographic identification only): “Reversal of genetic brain iron accumulation by N,N′-bis(2-mercaptoethyl)isophthalamide, a lipophilic metal chelator, in mice.” The title is the authors’ wording, not a statement established by this summary.
- Authors: Ruiying Cheng, Rajitha Gadde, Yingfang Fan, Neha Kulkarni, Nachiket Shevale, Kai Bao, Hak Soo Choi, Swati Betharia and Jonghan Kim. Cheng and Gadde contributed equally. Betharia and Kim are the corresponding authors.
- Institutions: University of Massachusetts Lowell; the Massachusetts College of Pharmacy and Health Sciences, Boston; Northeastern University; and Massachusetts General Hospital and Harvard Medical School.
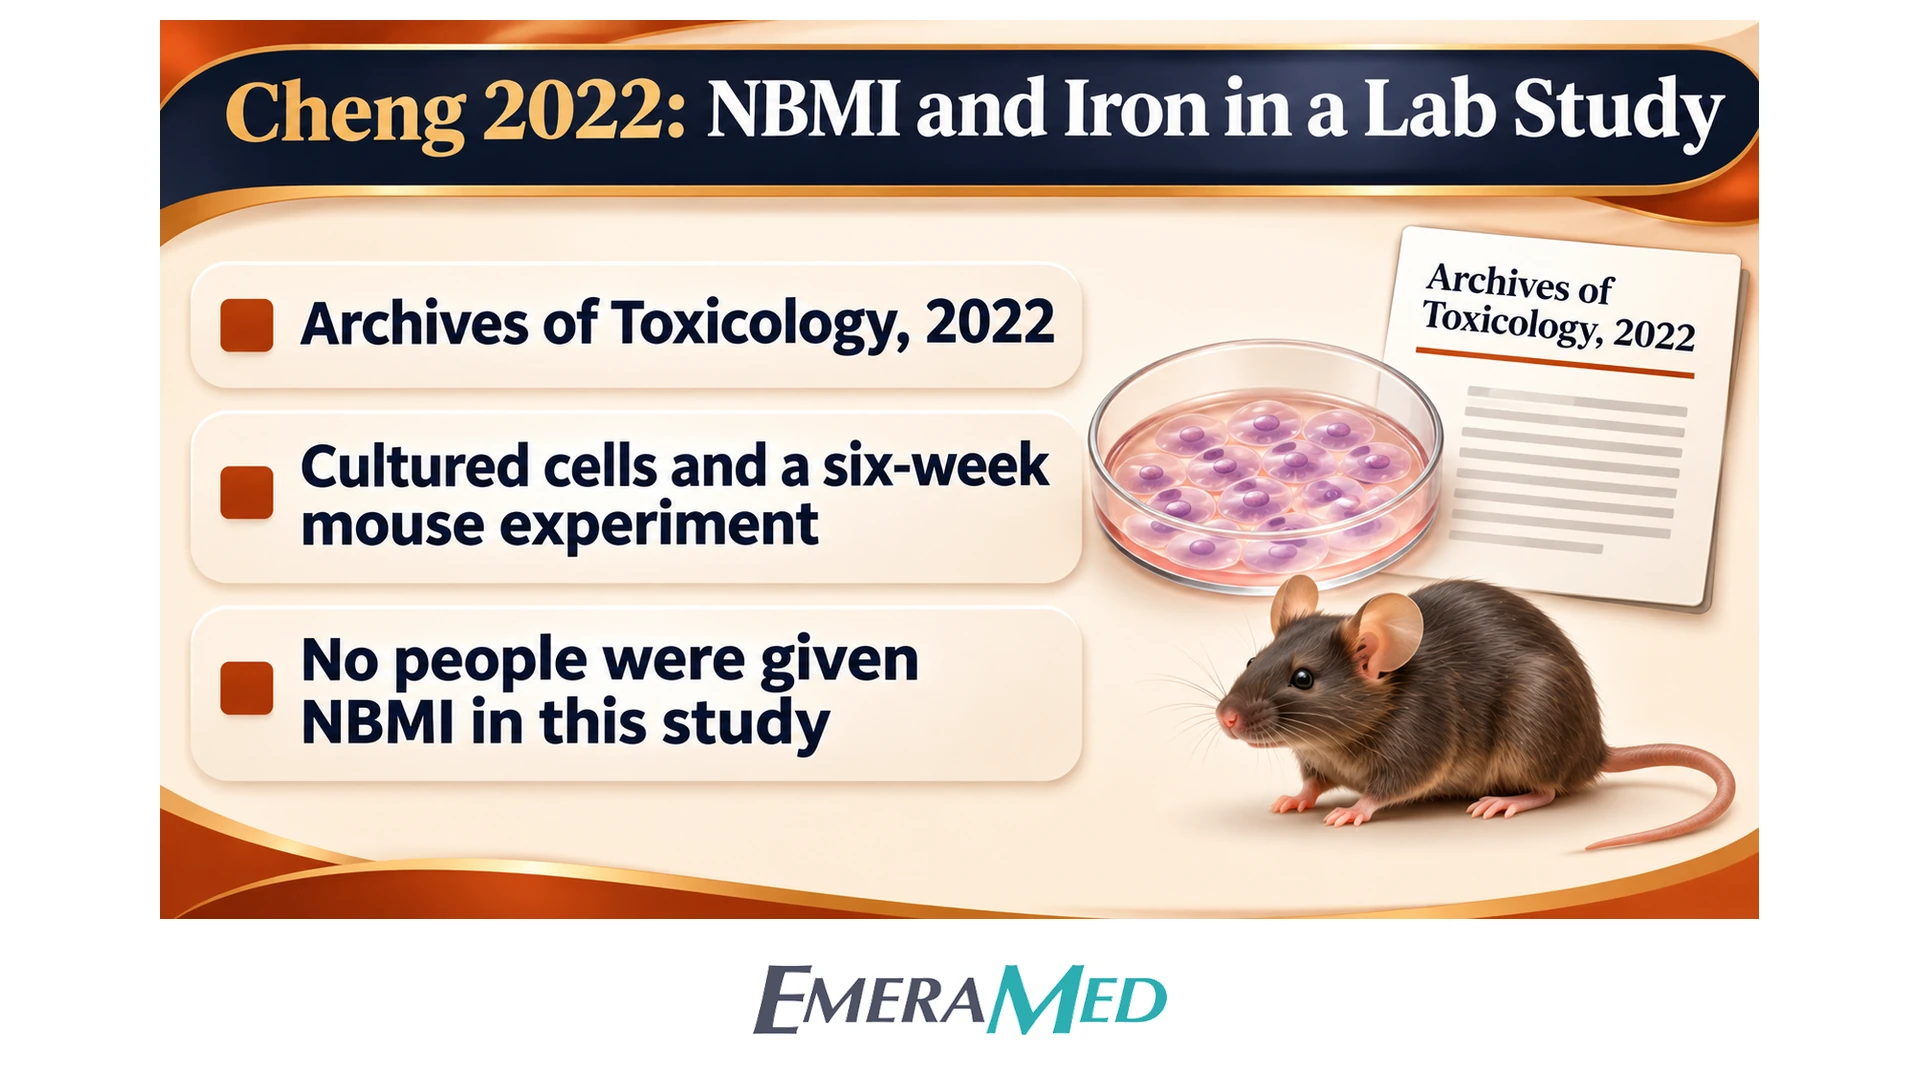
- Journal: Archives of Toxicology, 2022. The supplied paper is an online article with the digital object identifier below; a volume and page range are not printed in this file.
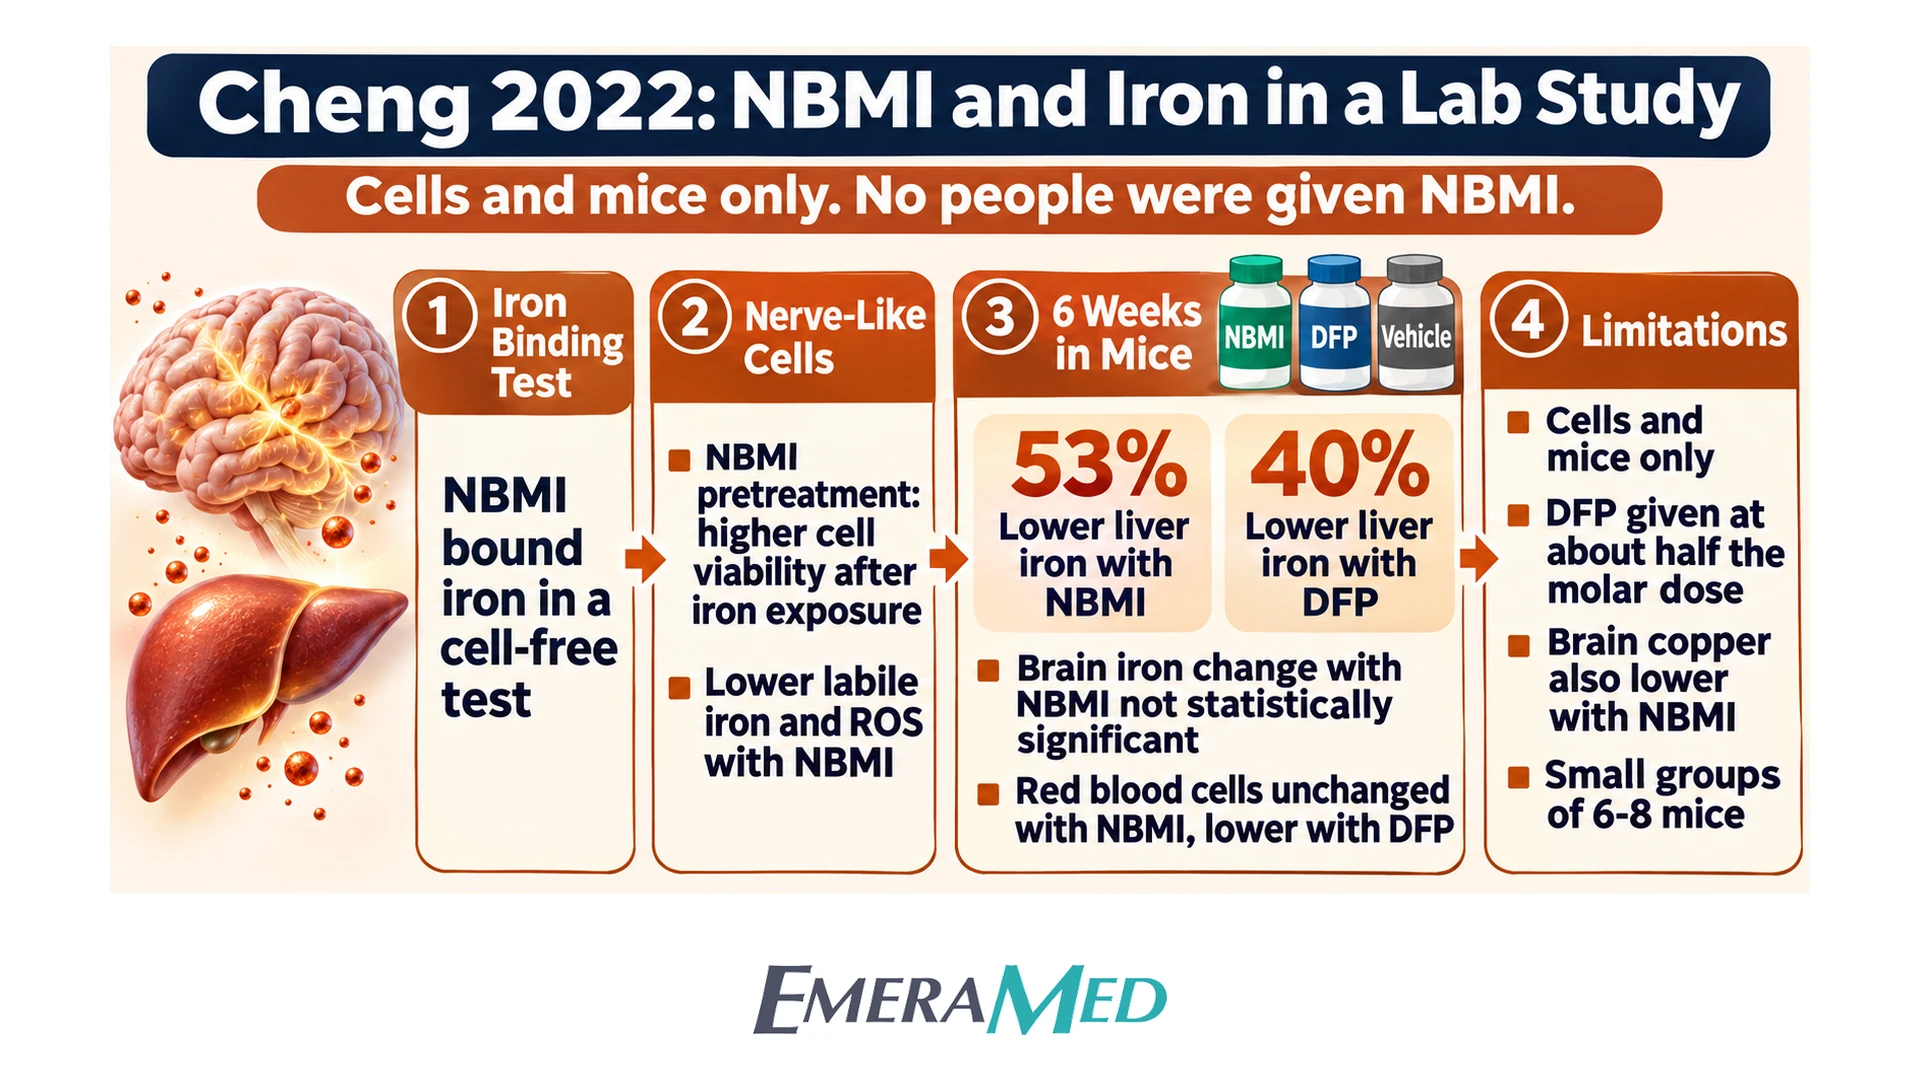
- Type of study: Laboratory work in cultured cells and a six-week mouse experiment. No people were given NBMI in this paper.
Why the study was done
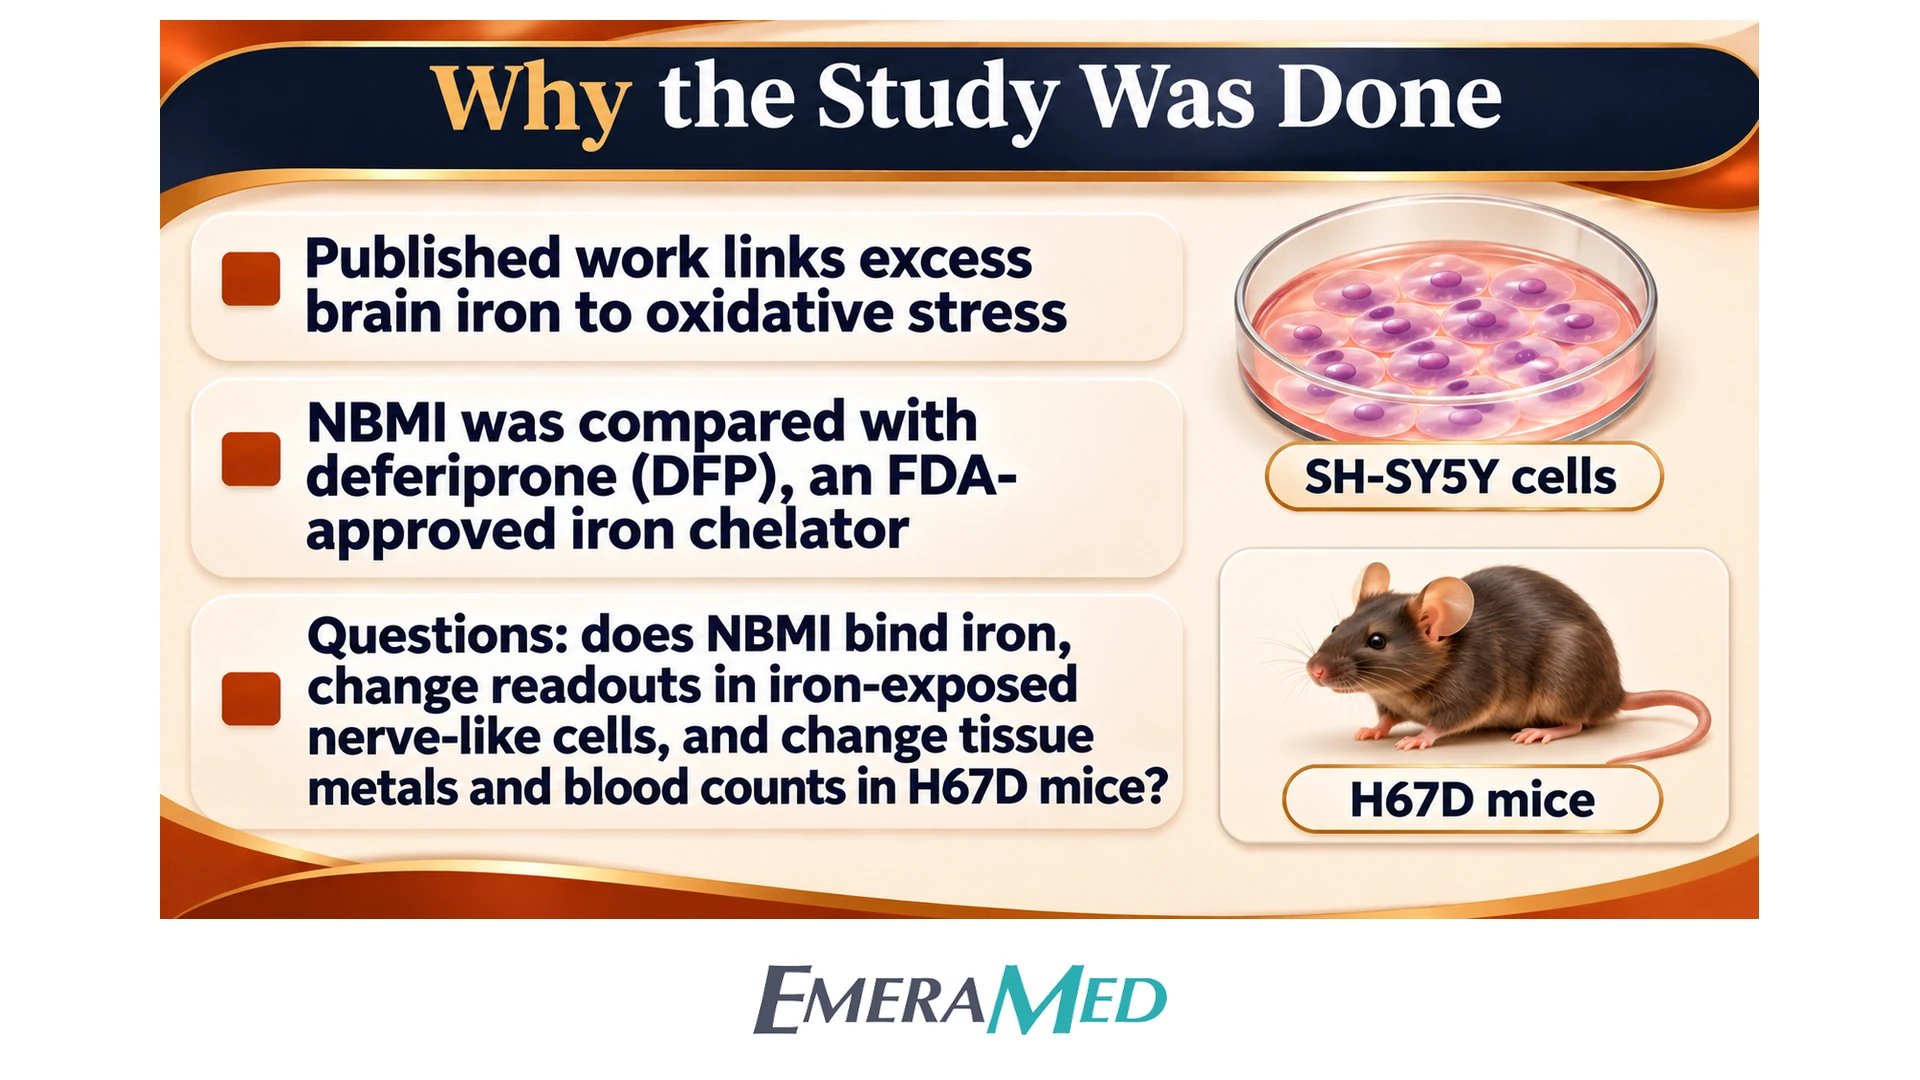
The authors review published work linking excess iron in the brain to oxidative stress. They describe NBMI (N,N′-bis(2-mercaptoethyl)isophthalamide), also called Emeramide, as an investigational, fat-soluble compound that can bind metals. As a comparator they used deferiprone (DFP), an FDA-approved oral iron chelator. Deferoxamine (DFO) and sodium 2,3-dimercaptopropanesulfonate (DMPS) were also used in the binding assay. Published limitations of DFO and DFP reviewed from other papers are background, not measurements from this experiment.
The team asked whether NBMI would bind iron in a cell-free assay, change laboratory readouts in iron-exposed SH-SY5Y human neuroblastoma cells, and change tissue metals, a brain oxidation marker, and blood counts in H67D mutant mice, which the authors describe as a model of brain iron accumulation. This paper does not show what would happen in people.
How the study was done (methods)
- Binding assay: Ferric chloride (25 µM) was pre-mixed with ferrozine (75 µM) in ascorbate buffer, then mixed with NBMI, DFO, DFP or DMPS for 24 hours. Absorbance at 562 nm was used to compare ferrous (Fe2+) binding; a ferric (Fe3+) comparison is described in the main text and a supplement. Association constants (K_A) came from three independent experiments.
- Cells: Human neuroblastoma SH-SY5Y cells (CRL-2266) were grown in DMEM with 10% fetal bovine serum at 37 °C in 5% CO₂. Experiments were done in triplicate. Ferric ammonium citrate (FAC) was first tested alone at 0–30 mM for 24 hours. Later cell experiments used 0.3 mM (300 µM) FAC. NBMI or DFP was applied at 0–50 µM for 24 hours, then replaced with FAC for 24 hours (viability) or 2 hours (calcein and reactive oxygen species, ROS). Viability was measured by CellTiter-Glo; labile iron by calcein fluorescence, which falls when labile iron is higher; and ROS by DCF-DA fluorescence.
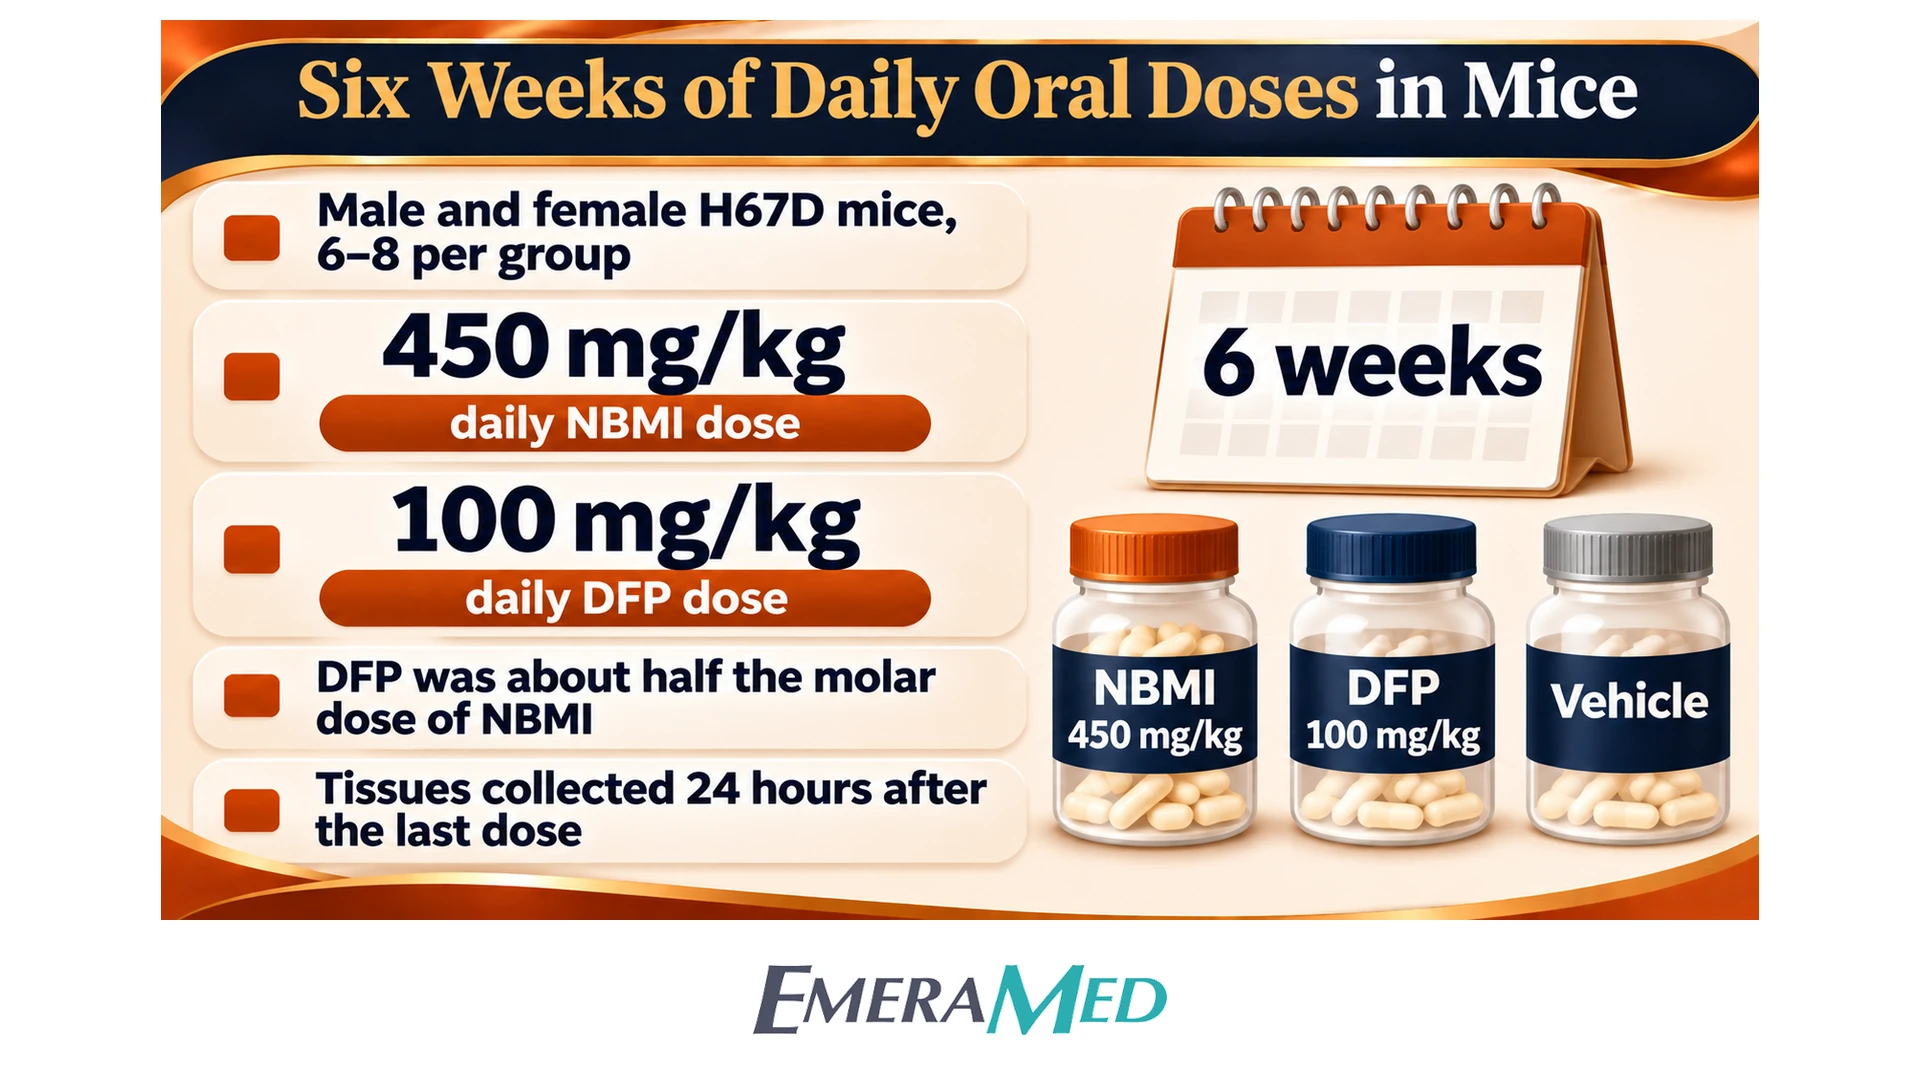
- Mice: Male and female H67D mutant mice, and wild-type mice, started at 5–6 weeks of age, n = 6–8 per group, on chow containing 380 mg iron per kg. They received daily oral gavage of NBMI 450 mg/kg, DFP 100 mg/kg, or vehicle (0.5% carboxymethyl cellulose) for 6 weeks, and were euthanized 24 hours after the last dose. The authors later state that those doses equal 1.58 mmol/kg of NBMI and 0.71 mmol/kg of DFP, so the DFP dose was about half the molar dose of NBMI.
- In-life readouts: Liver non-heme iron; cortical iron, zinc and copper; brain isoprostane, a lipid-oxidation marker; and complete blood counts (n = 5–7 per group). Figures 4 and 5 compare the three assigned groups in H67D mice, with gray reference bands for wild-type levels where shown.
- Analysis: After a normality test, groups were compared by one-way ANOVA with Bonferroni’s test or by a Kruskal–Wallis test with Dunn’s test. Significance was accepted at p < 0.05. Results are means ± SEM, or mean + SEM in some figure legends.
What the researchers observed
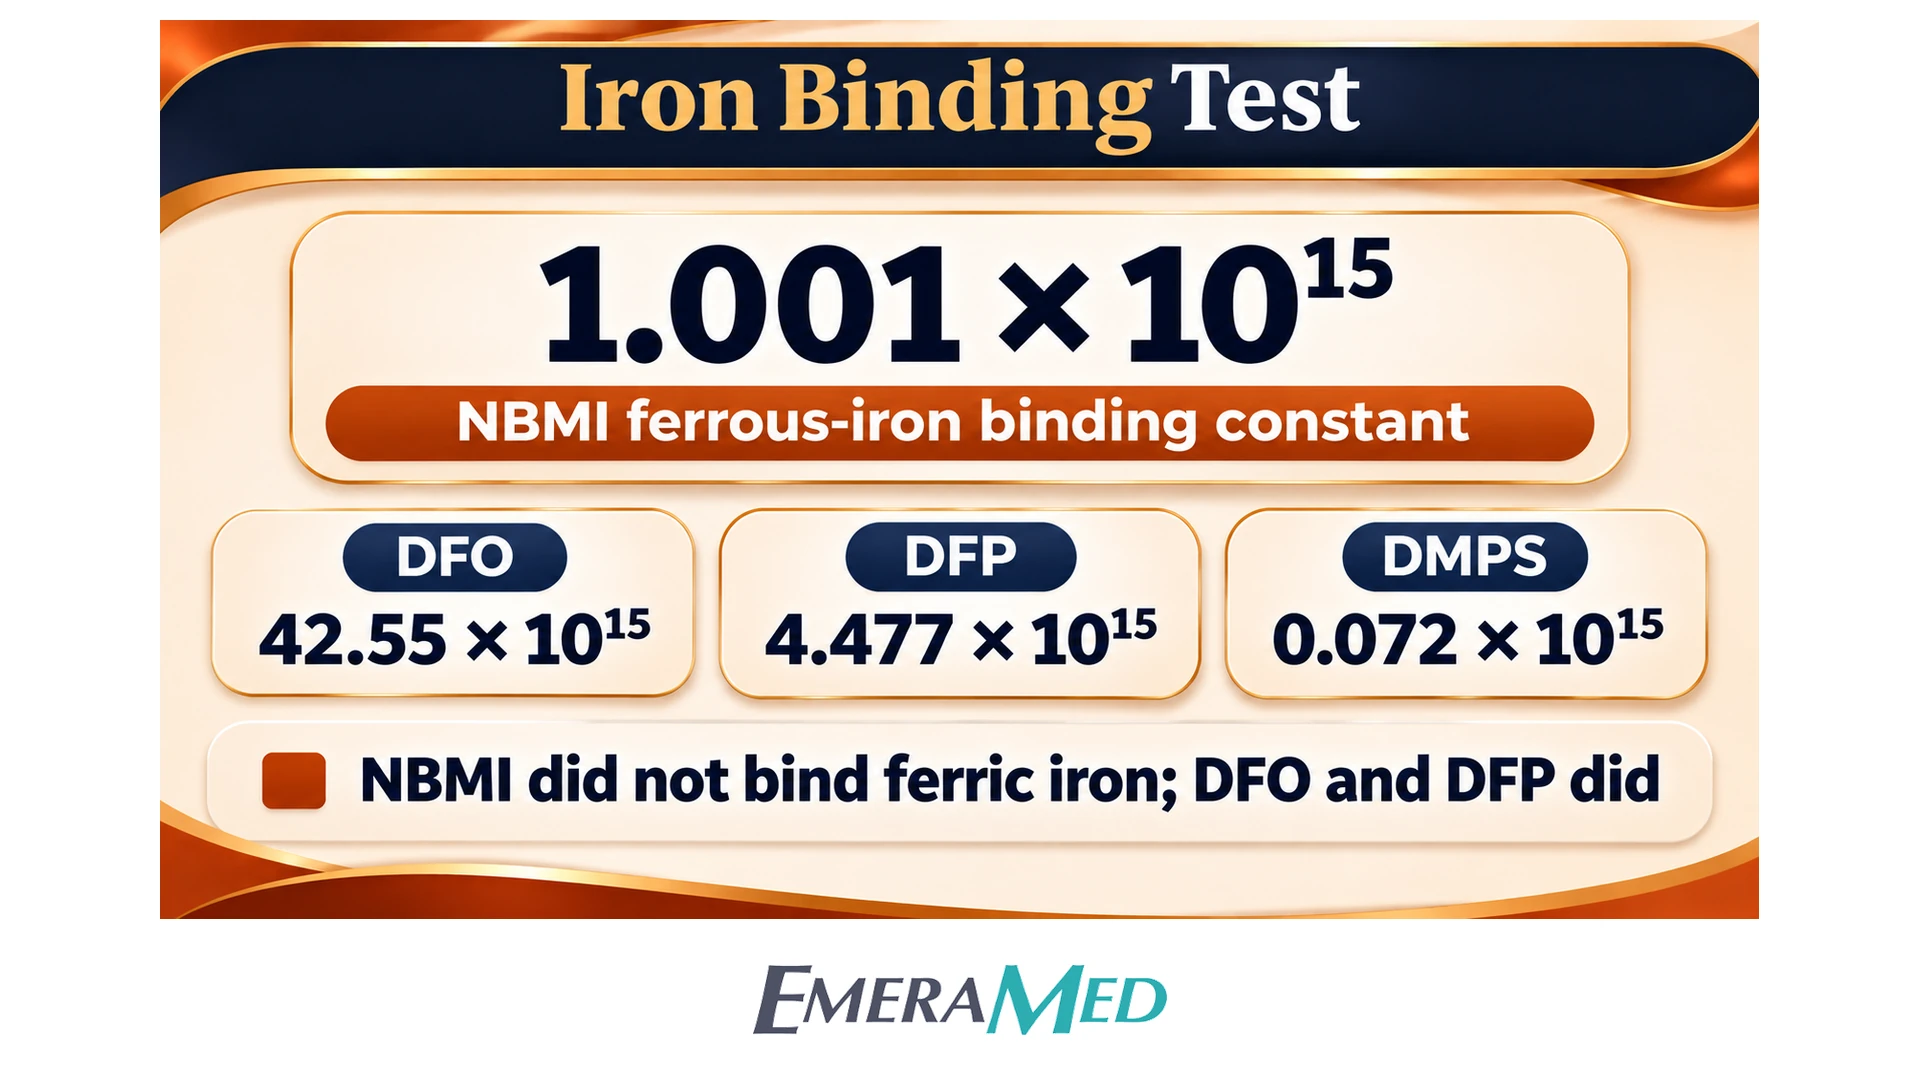
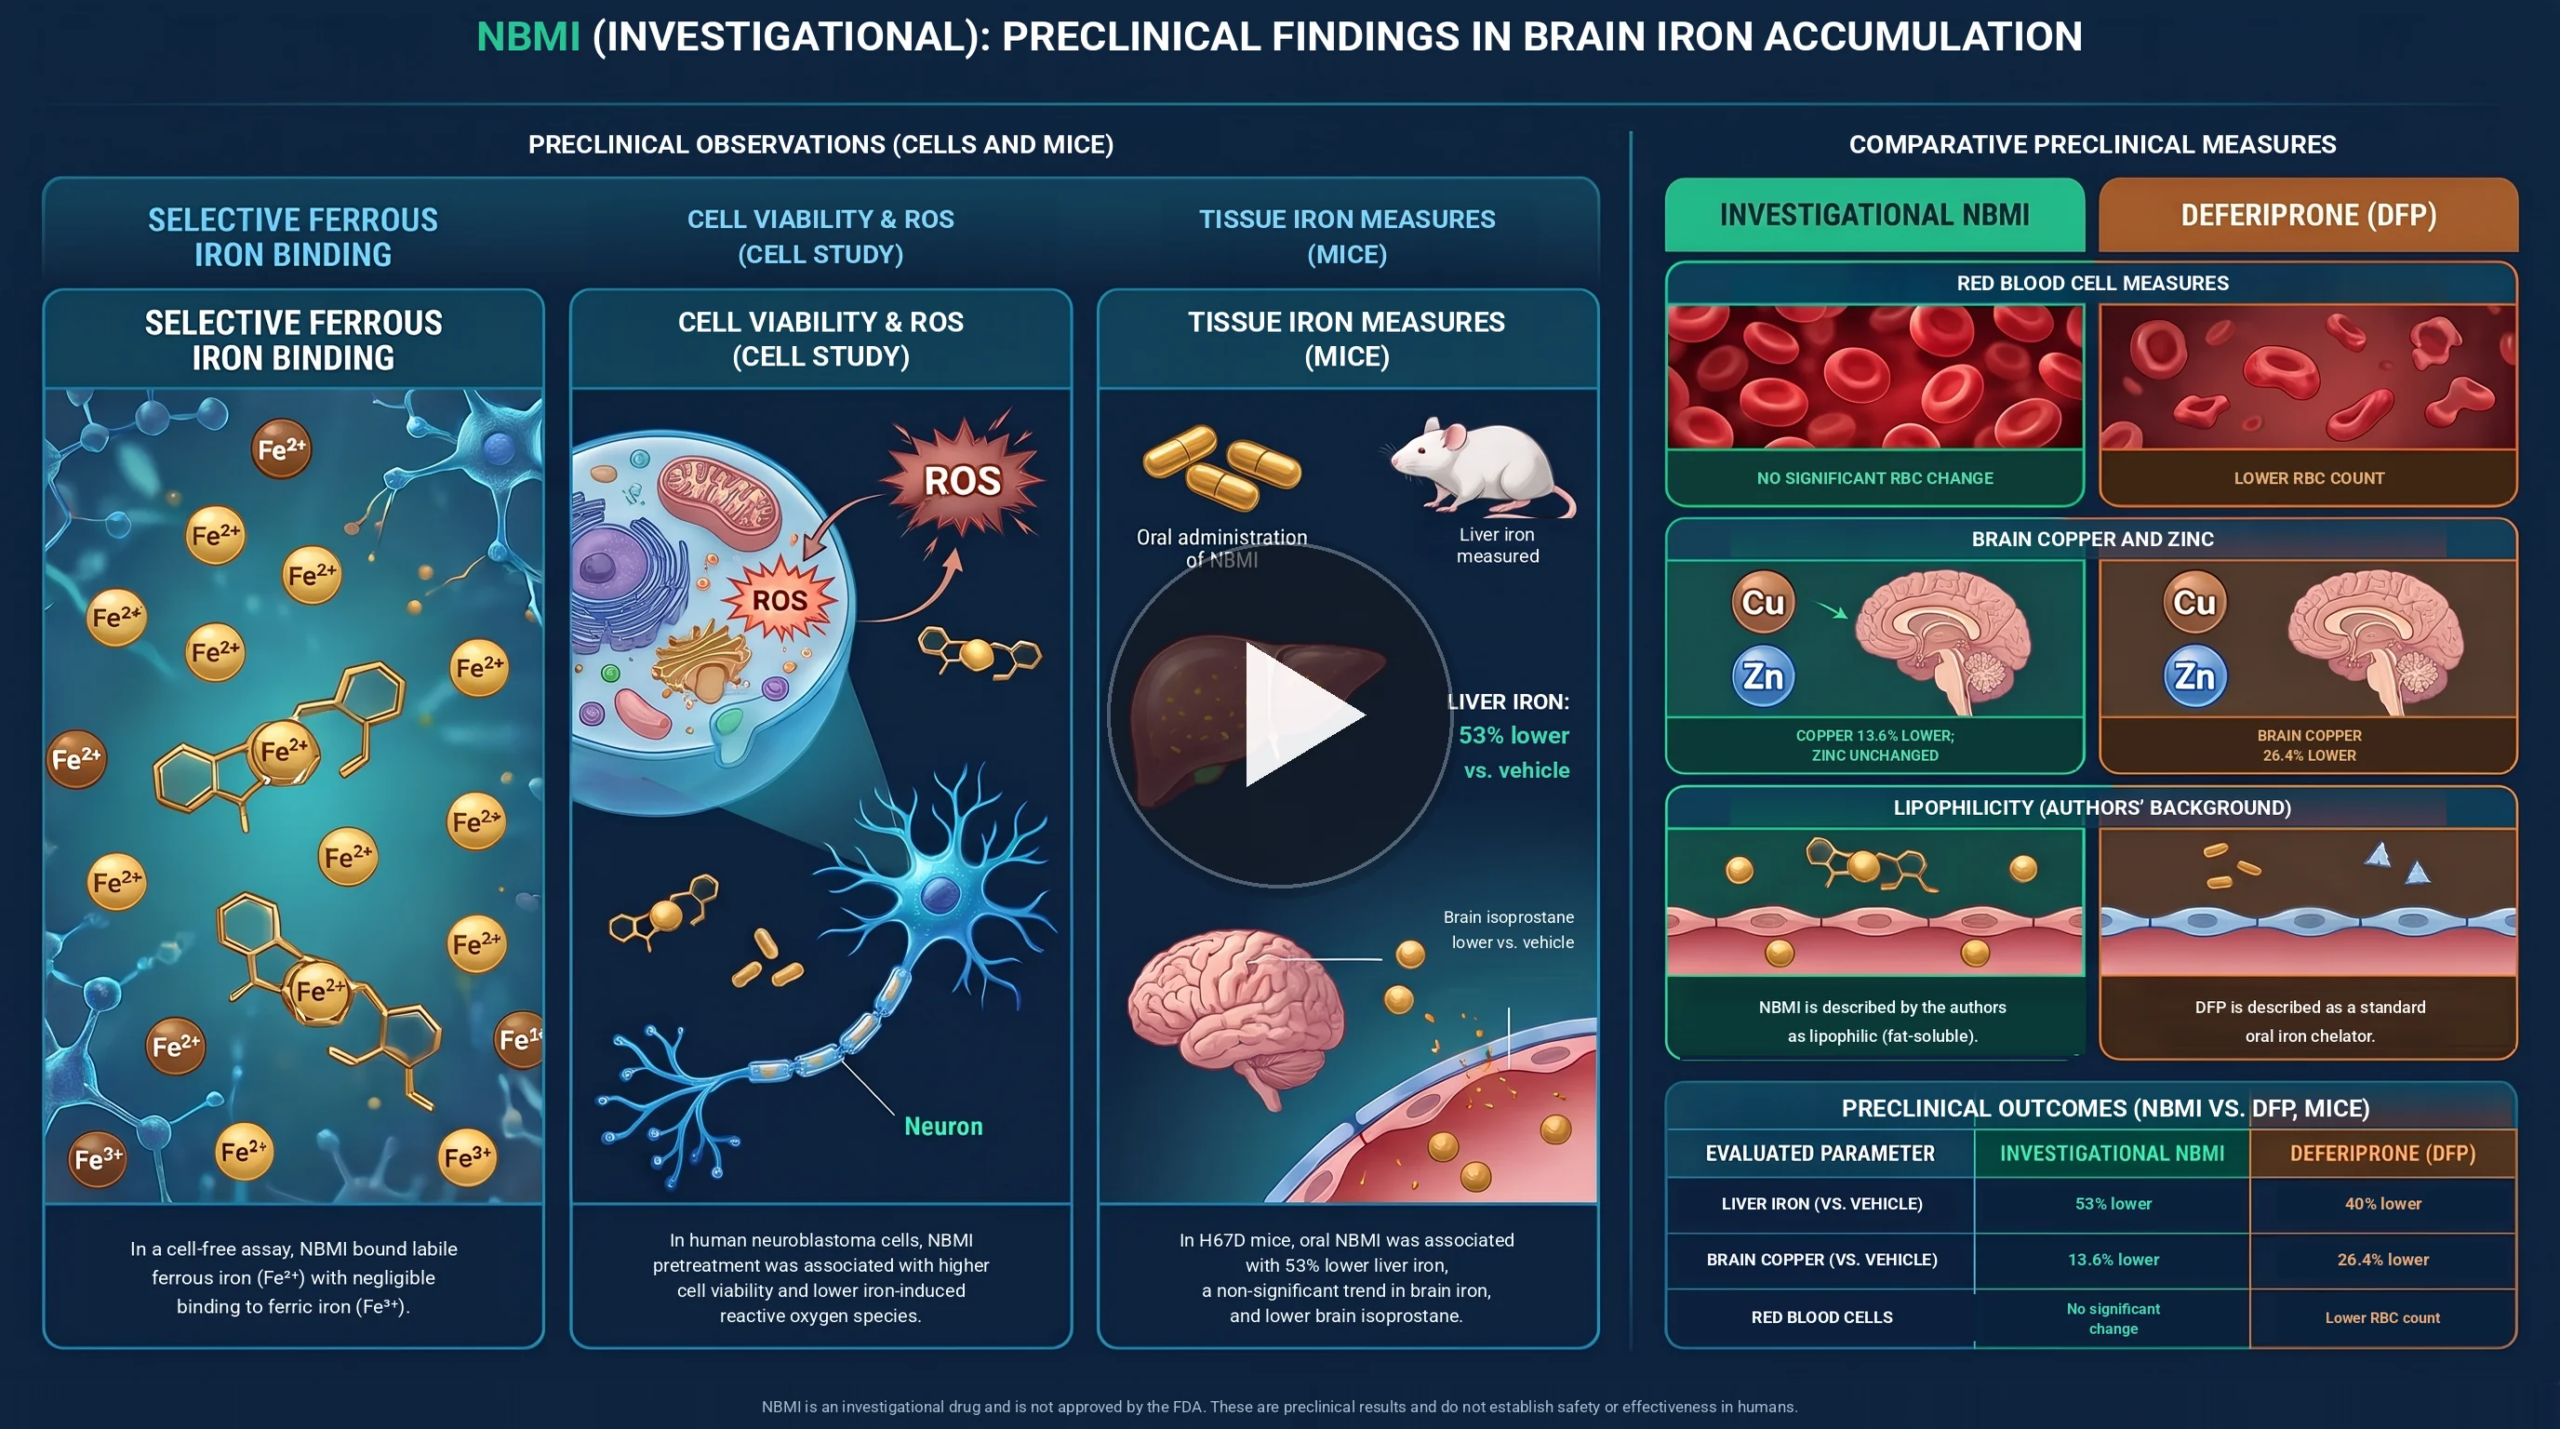
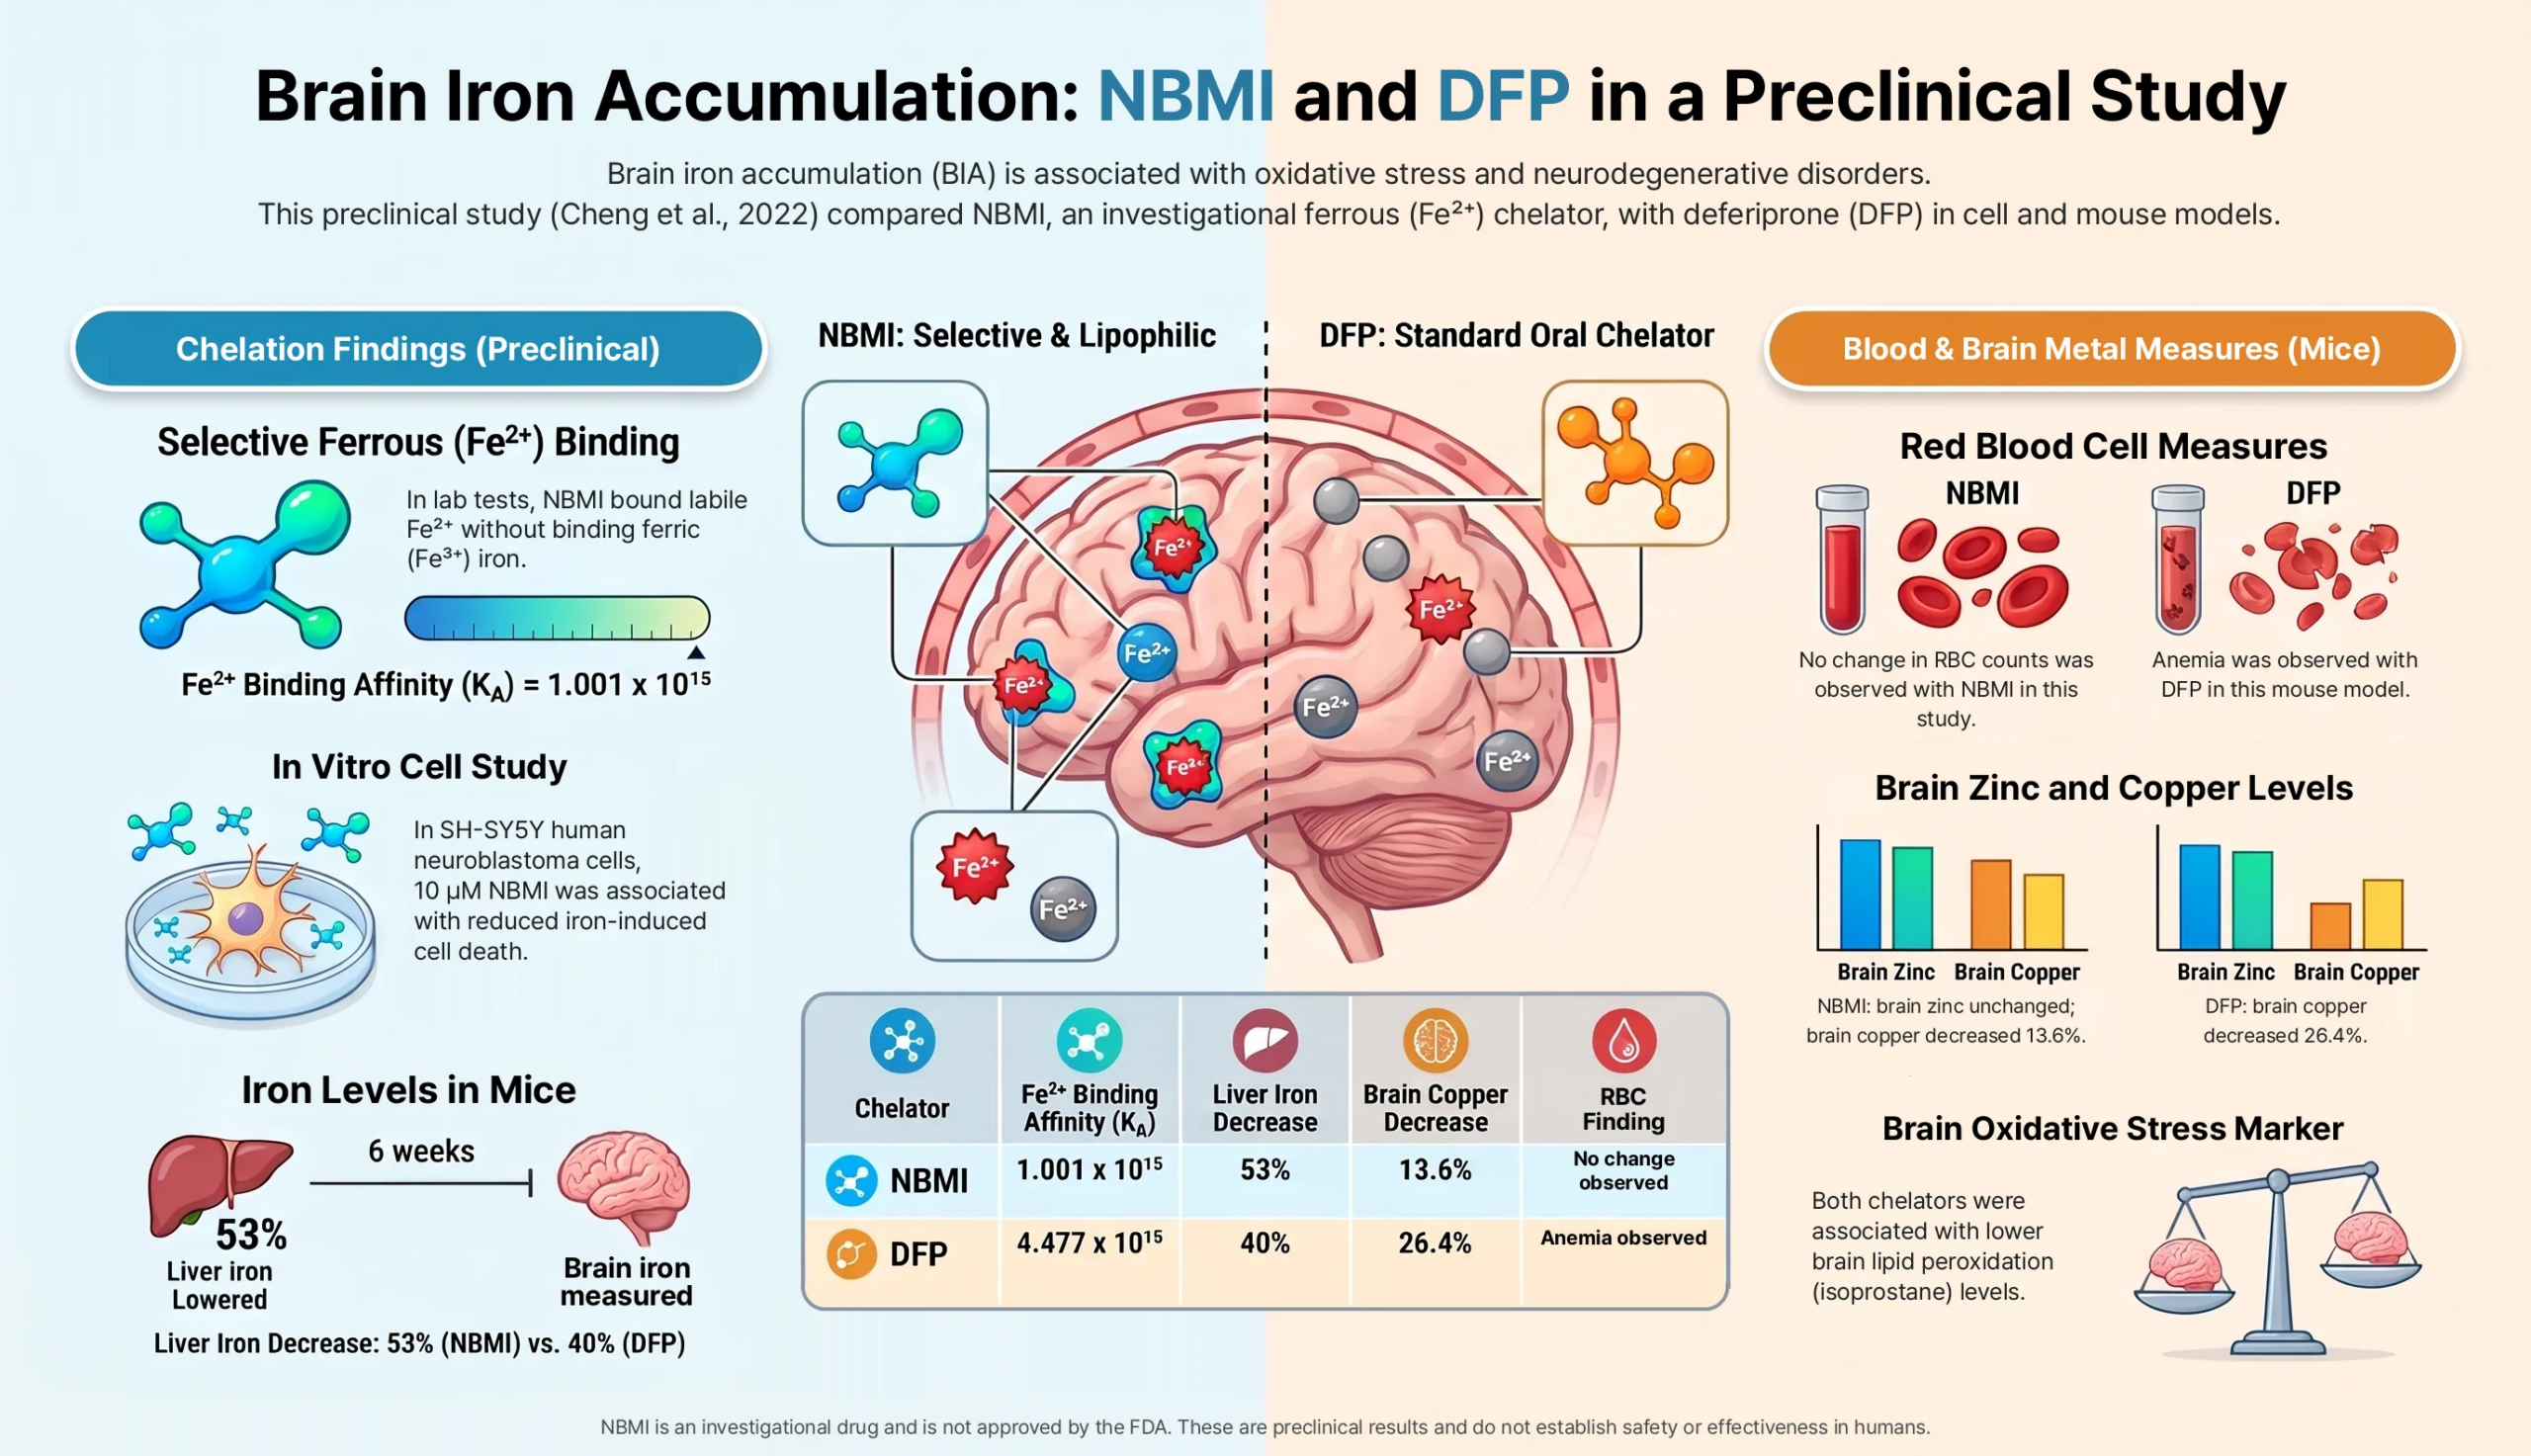
Iron binding (Figure 1 and page 5). For ferrous iron, the reported association constants were 1.001 × 10^15 for NBMI, 42.55 × 10^15 for DFO, 4.477 × 10^15 for DFP and 0.072 × 10^15 for DMPS. The authors describe the NBMI constant as 42.6-fold lower than DFO, 4.5-fold lower than DFP, and 13.8 times higher than DMPS. They report that NBMI and DMPS were not bound to ferric iron, while DFO and DFP were, with ferric constants of 3.7 × 10^25 and 3.5 × 10^23, respectively.
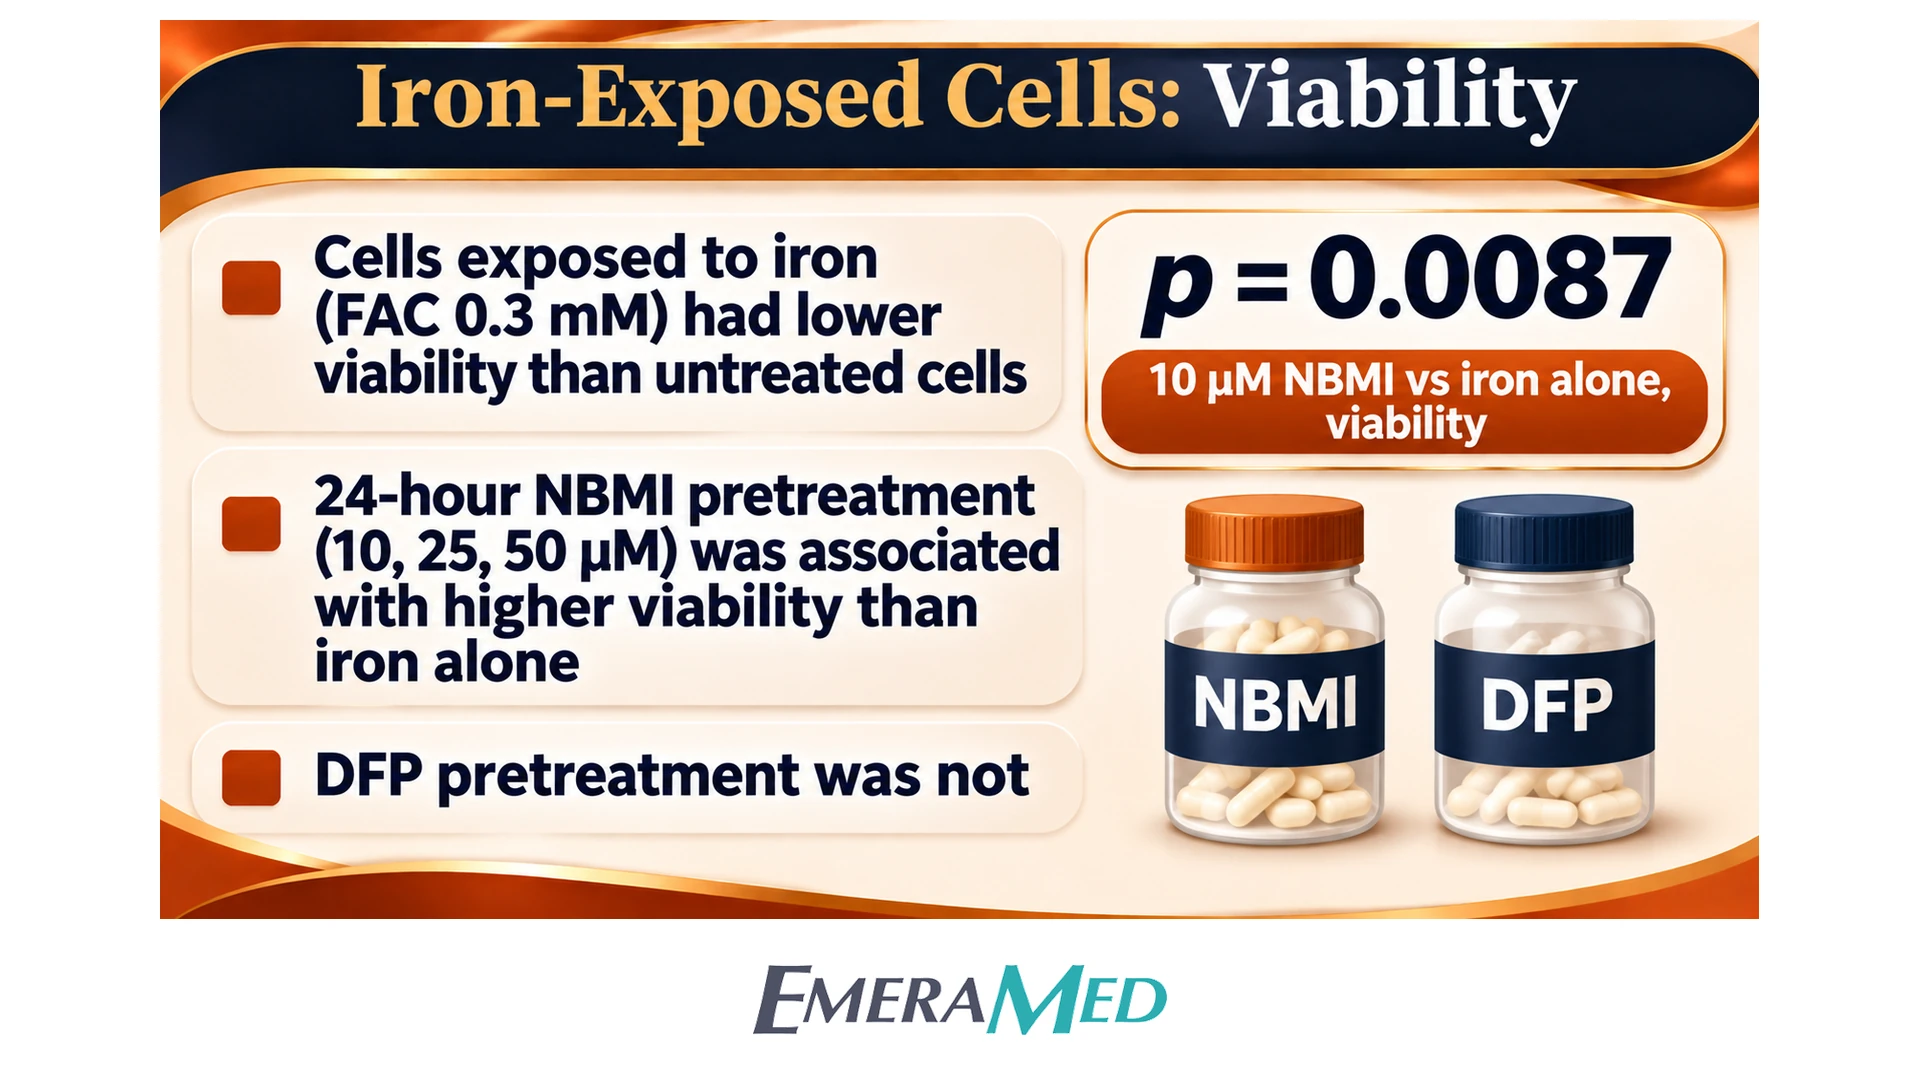
FAC and cell viability (Figure 2 and page 9). FAC 0.3 mM was associated with lower viability than untreated cells (p = 0.0002). The authors describe an inverted-U pattern for FAC alone: 31% cytotoxicity at 0.3 mM, no statistically significant change at 1 and 3 mM, then 45% cytotoxicity at 10 mM and 95% at 30 mM. After a 24-hour pretreatment, 10, 25 and 50 µM NBMI were each associated with higher viability than FAC alone (figure marks *; p = 0.0087 is given for 10 µM NBMI). In the same design, DFP pretreatment did not show a statistically significant change in viability versus FAC alone. In a separate timing described only in the main text and a supplement, applying either compound after FAC was associated with a change in the FAC-related viability readout; exact values from that supplement are not in the supplied main paper. No statistically significant cytotoxicity was reported for either compound up to 50 µM in this assay. In the discussion, the authors note that 50 µM NBMI without FAC was associated with higher cell counts, and that there was no increase in cell count at 10 µM.
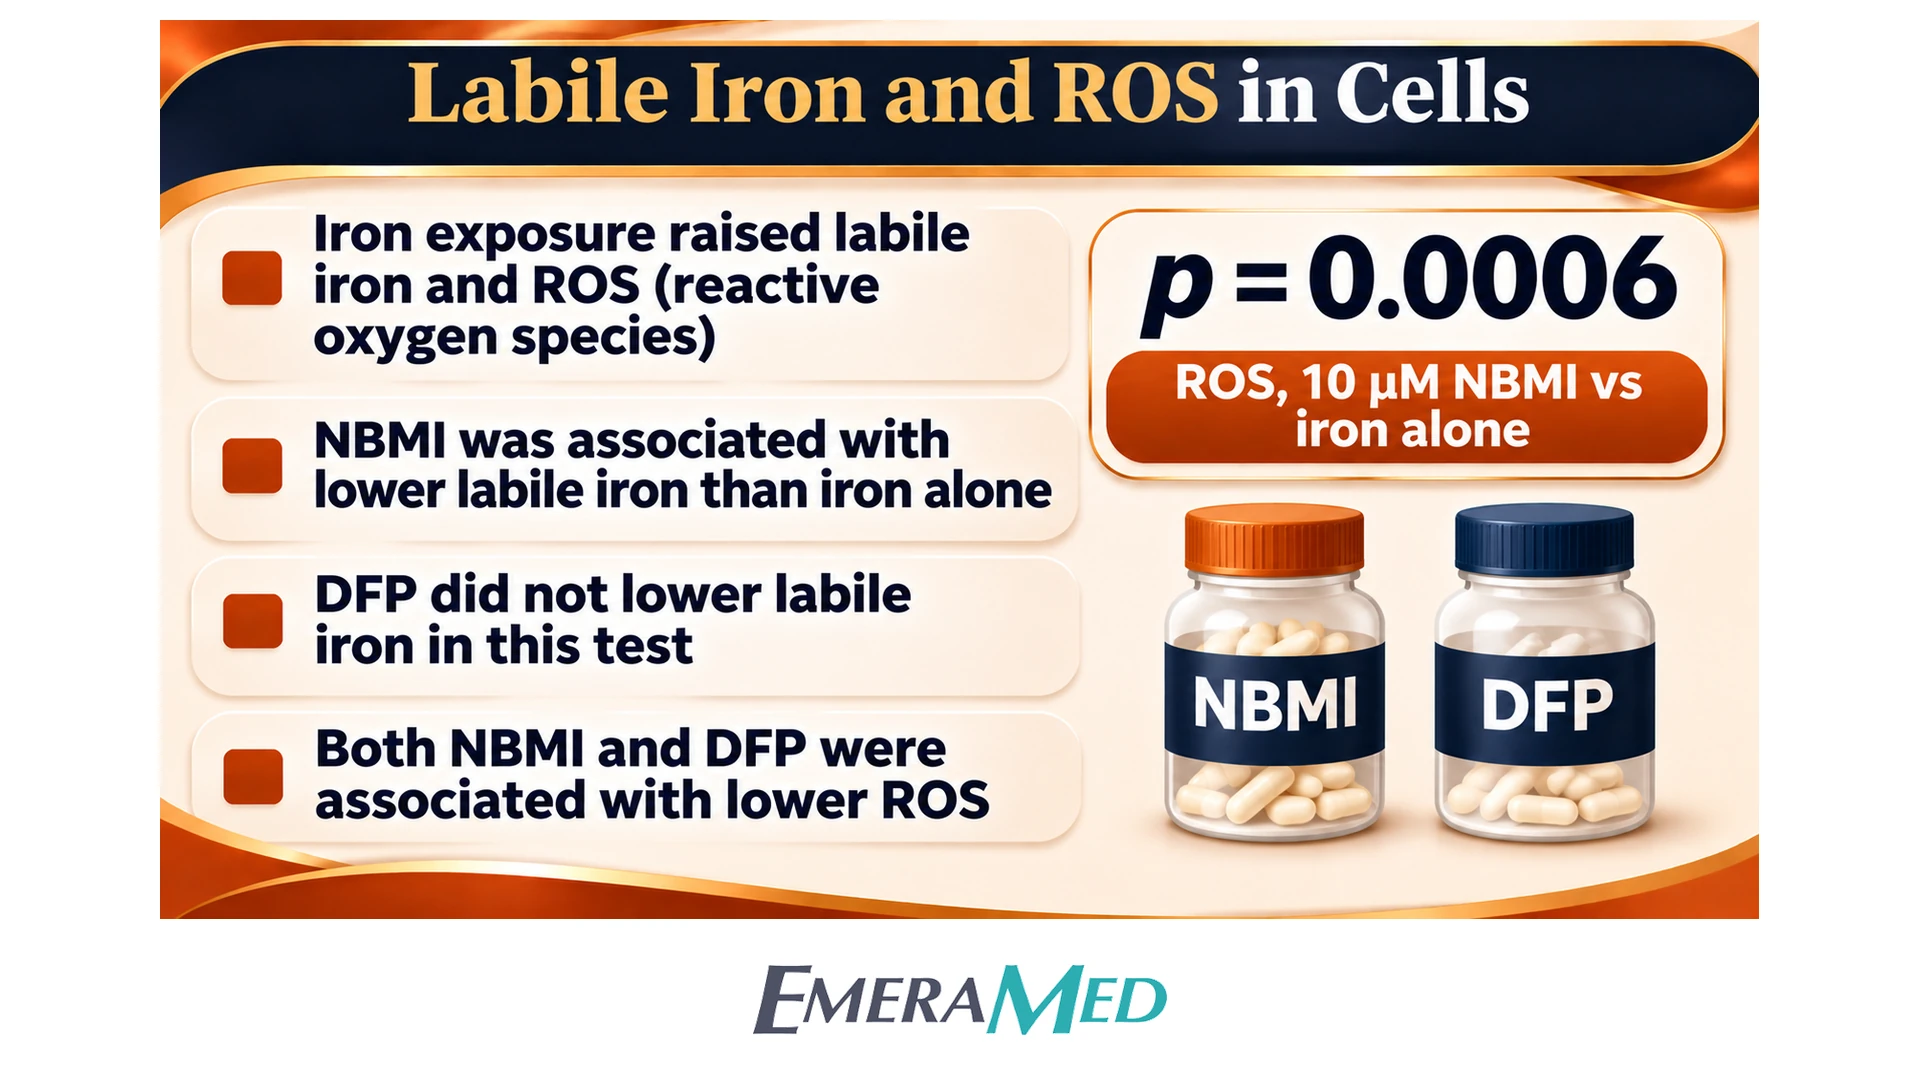
Labile iron and ROS (Figure 3). FAC 0.3 mM was associated with lower calcein fluorescence, indicating higher labile iron (p = 0.0428). NBMI at all tested concentrations was associated with higher calcein fluorescence than FAC alone (p < 0.05). DFP was not associated with a statistically significant change in labile iron in this assay. FAC was associated with higher ROS (p < 0.0001). Both NBMI, from 10 µM (p = 0.0006), and DFP at the same molar concentrations (p = 0.0089), were associated with lower ROS than FAC alone (figure marks * at 10, 25 and 50 µM for both). The authors interpret the DFP ROS finding, in the absence of a labile-iron change, as an antioxidant action not explained by iron binding in this assay.
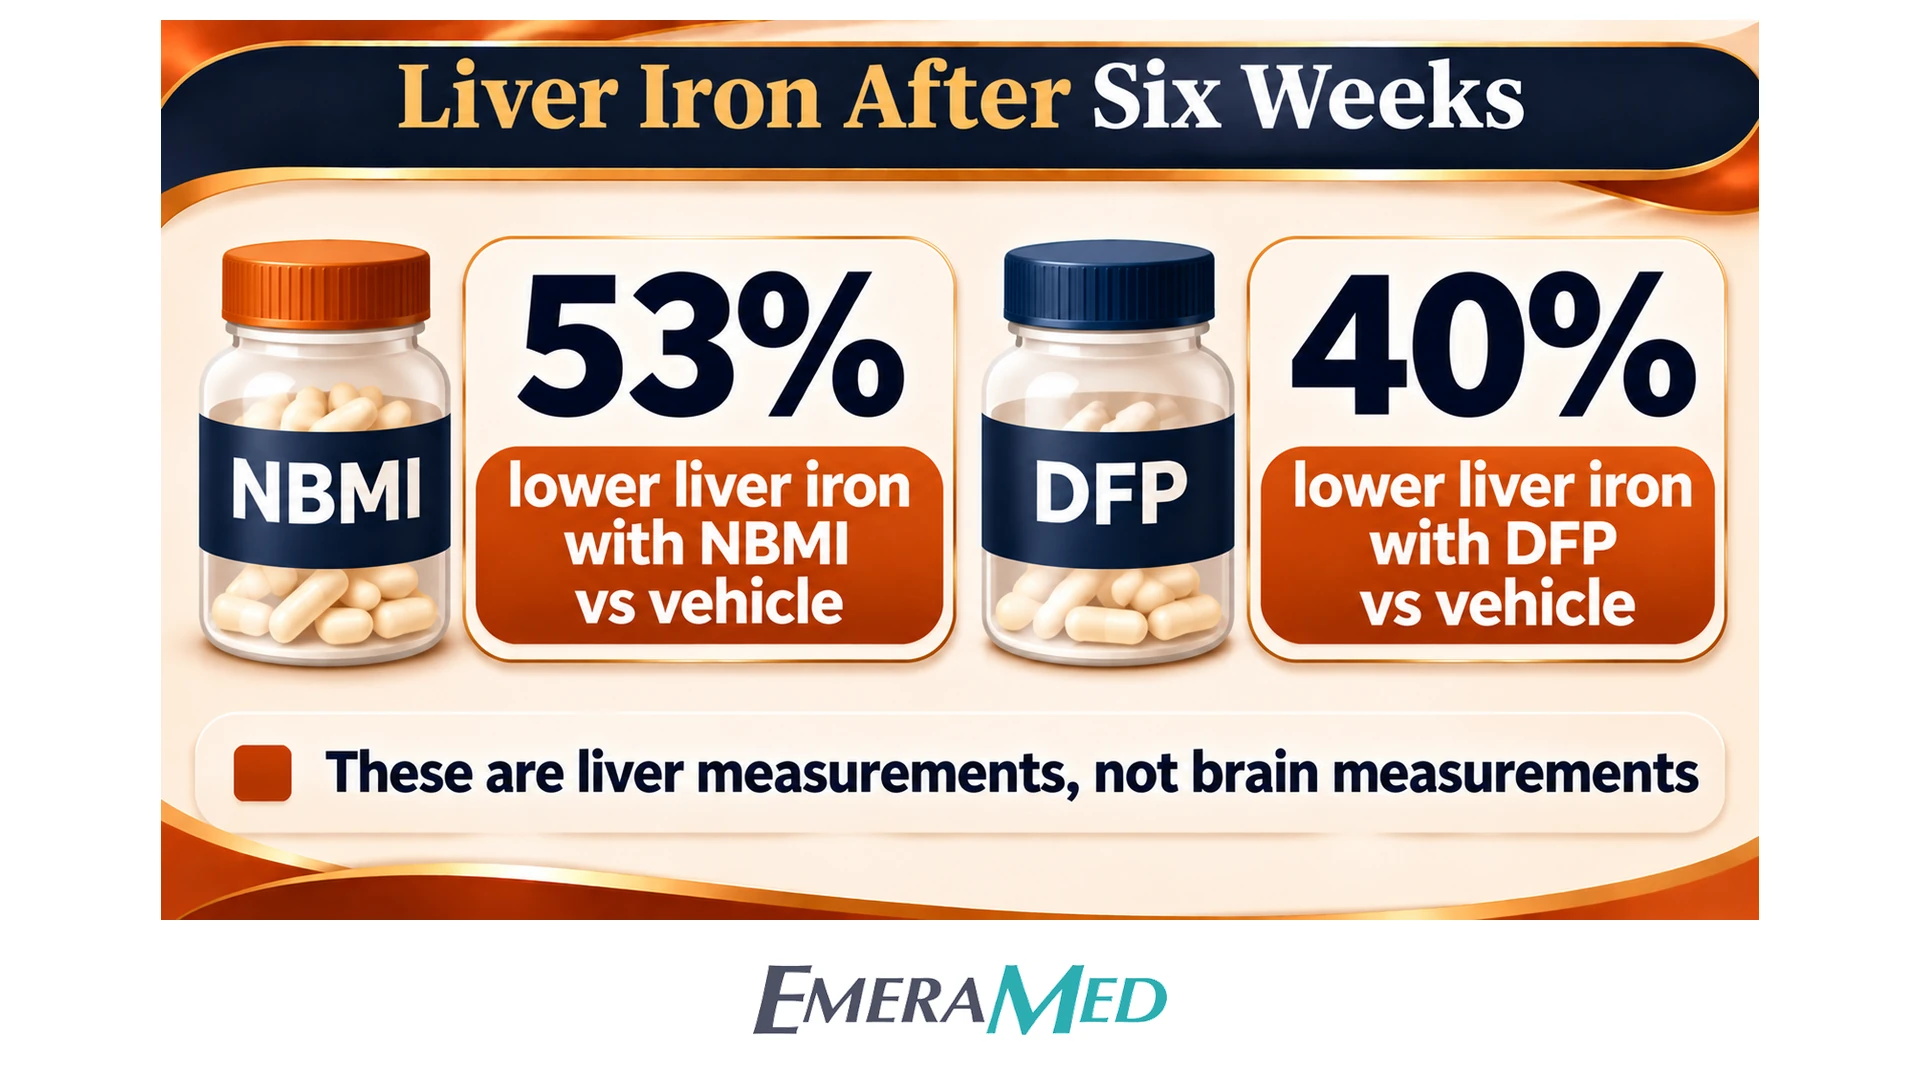
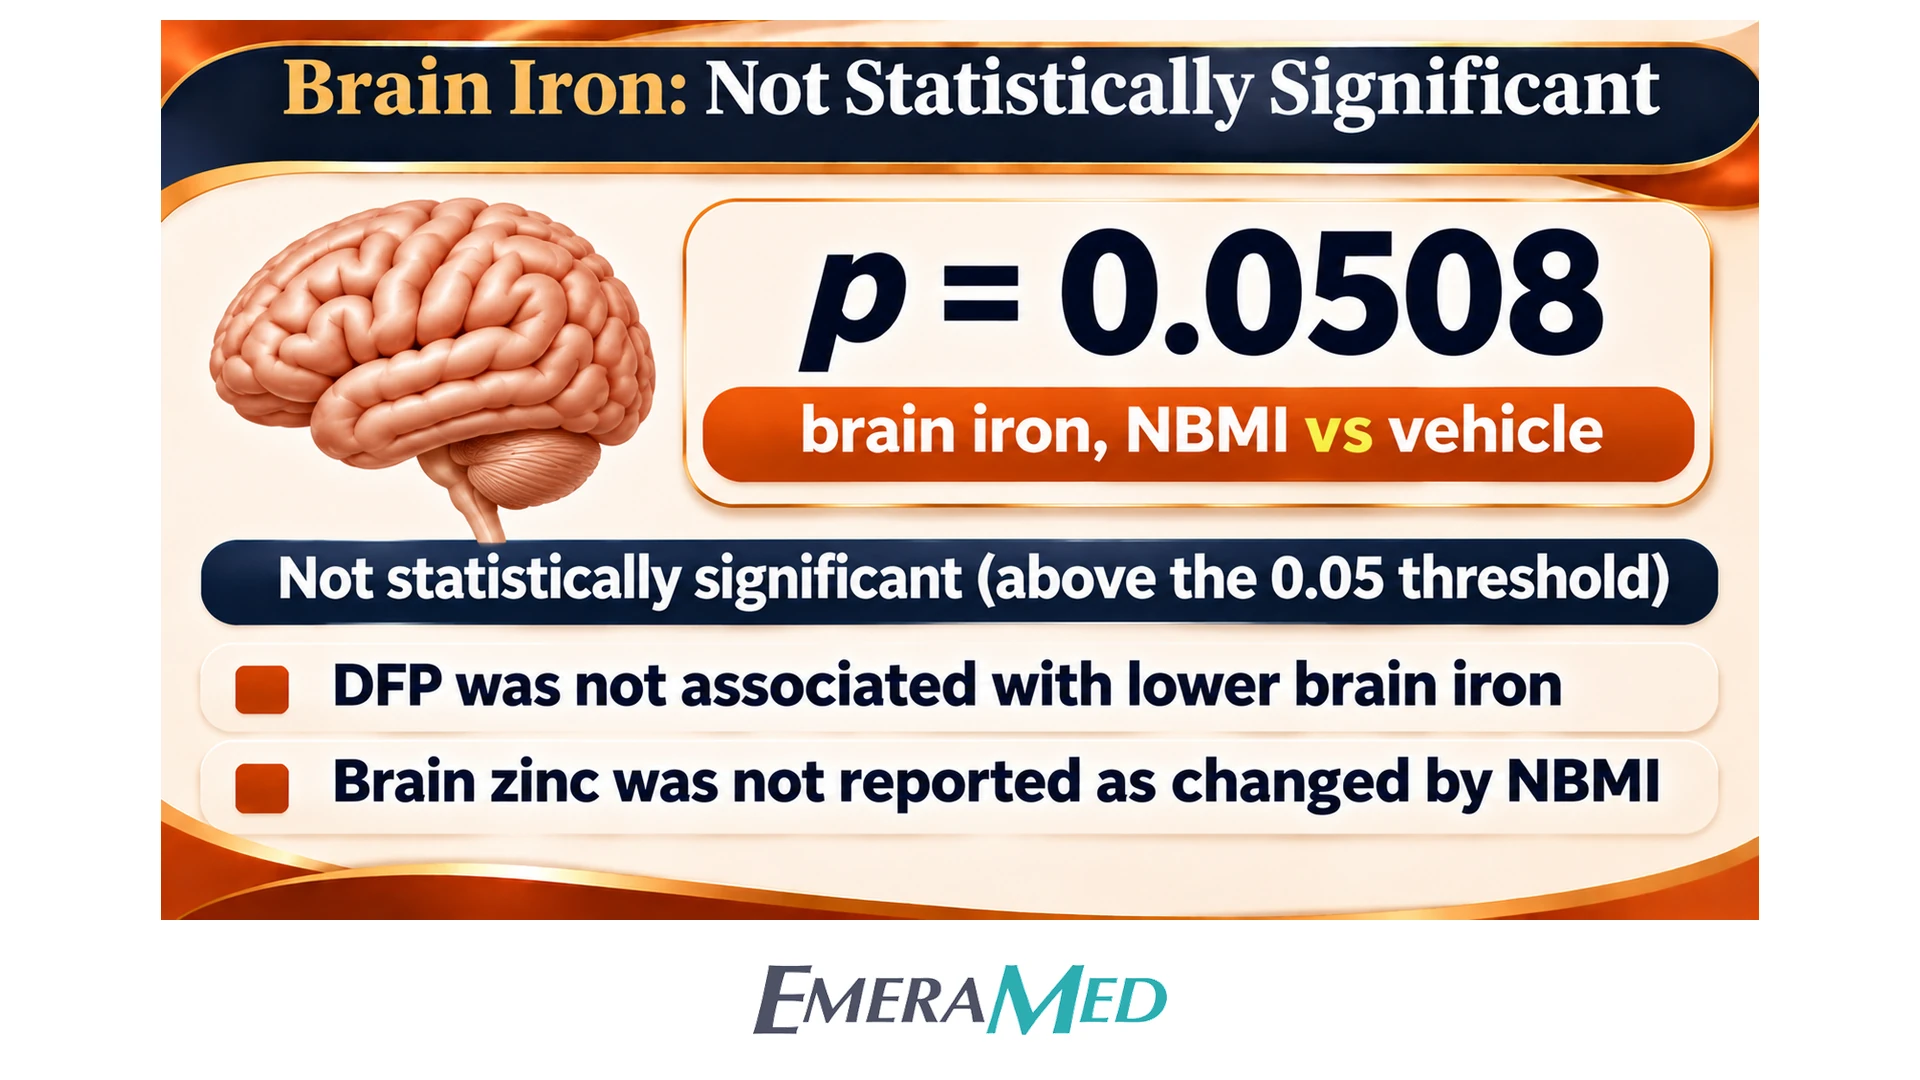
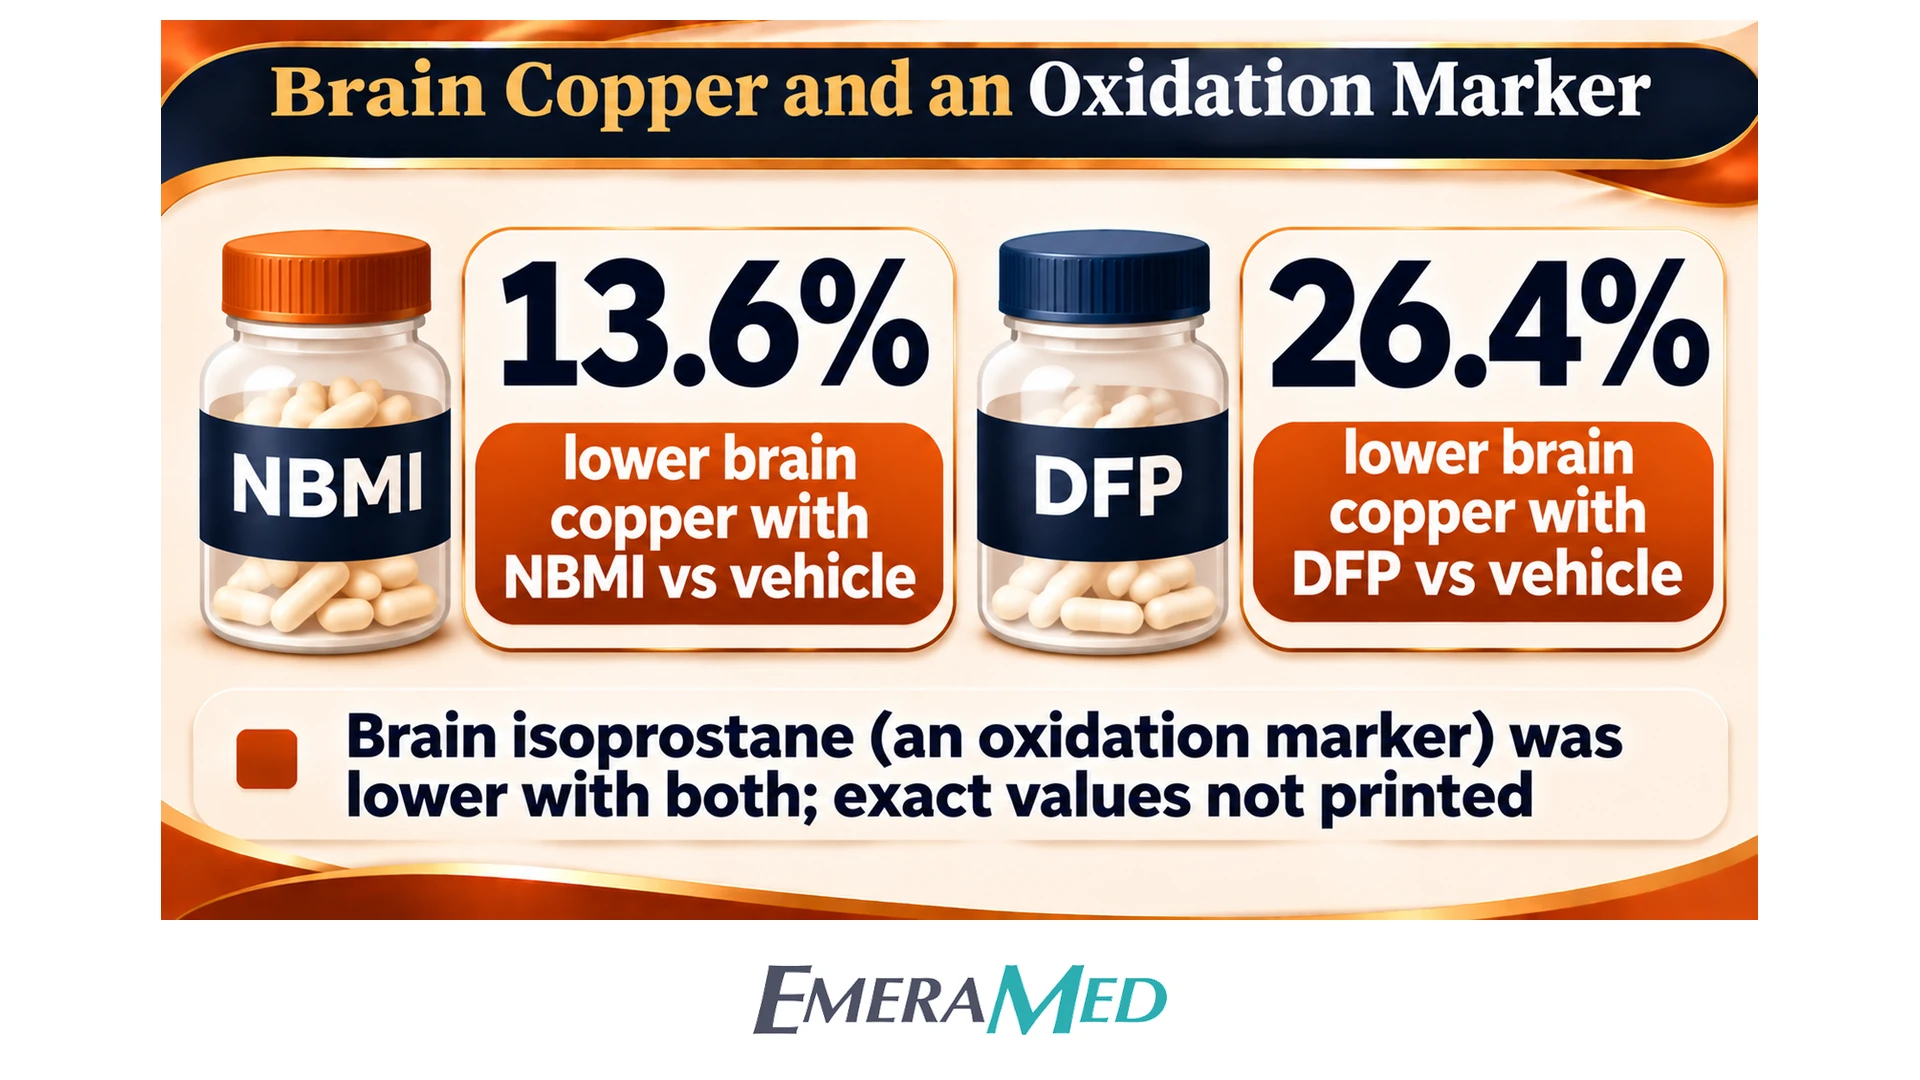
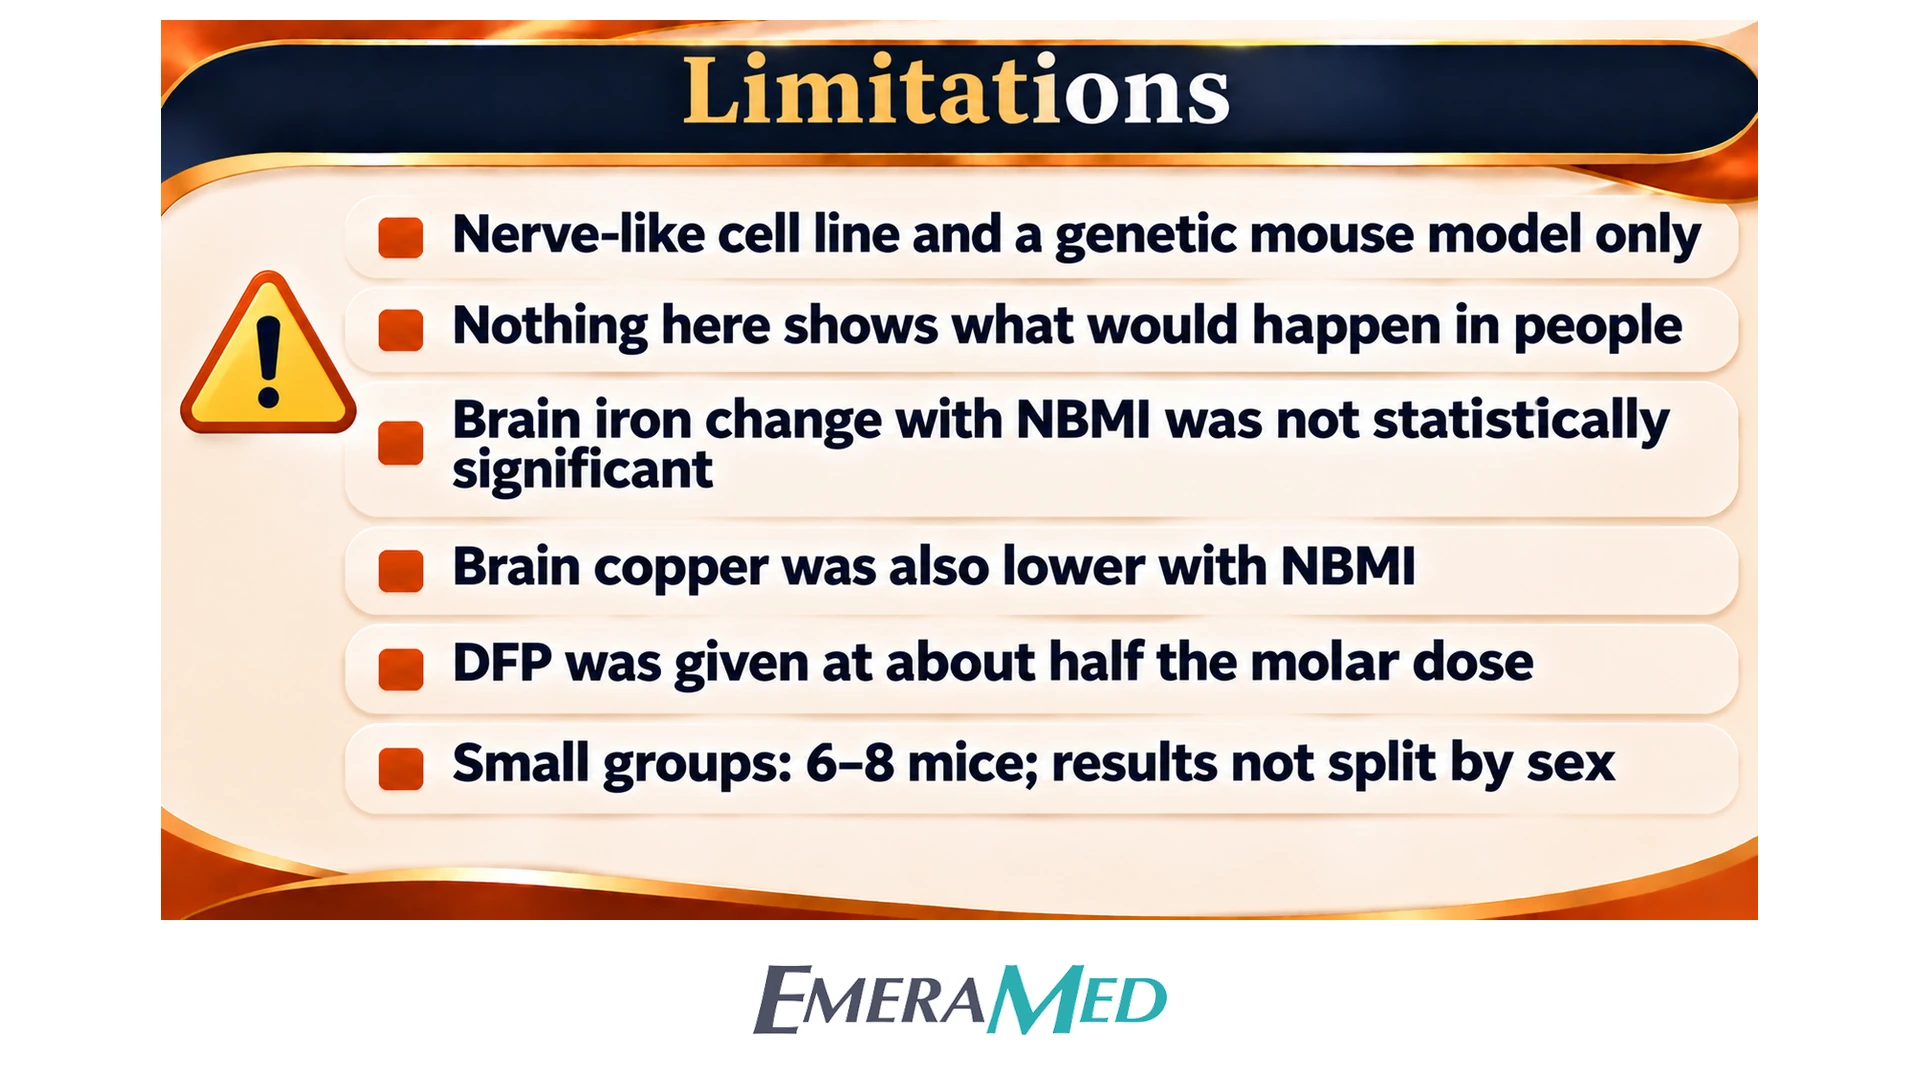
Liver and brain metals in H67D mice (Figure 4). Compared with vehicle, liver non-heme iron was 53% lower with NBMI (p = 0.0038). Compared with vehicle, liver non-heme iron was 40% lower with DFP (p = 0.0324). The molar doses of the two compounds were not equal. Brain cortical iron with NBMI had p = 0.0508 versus vehicle, which the authors call a trend with borderline statistical significance. That comparison does not meet the paper’s p < 0.05 threshold. No statistically significant decrease in brain iron versus vehicle was reported for DFP. Brain zinc was not reported as changed by NBMI. Brain copper was 13.6% lower with NBMI and 26.4% lower with DFP; Figure 4D marks both comparisons as p < 0.05 versus vehicle. Brain isoprostane was lower with both compounds than with vehicle, and the authors state that those levels were in the range measured in wild-type brain; exact isoprostane values are not printed.
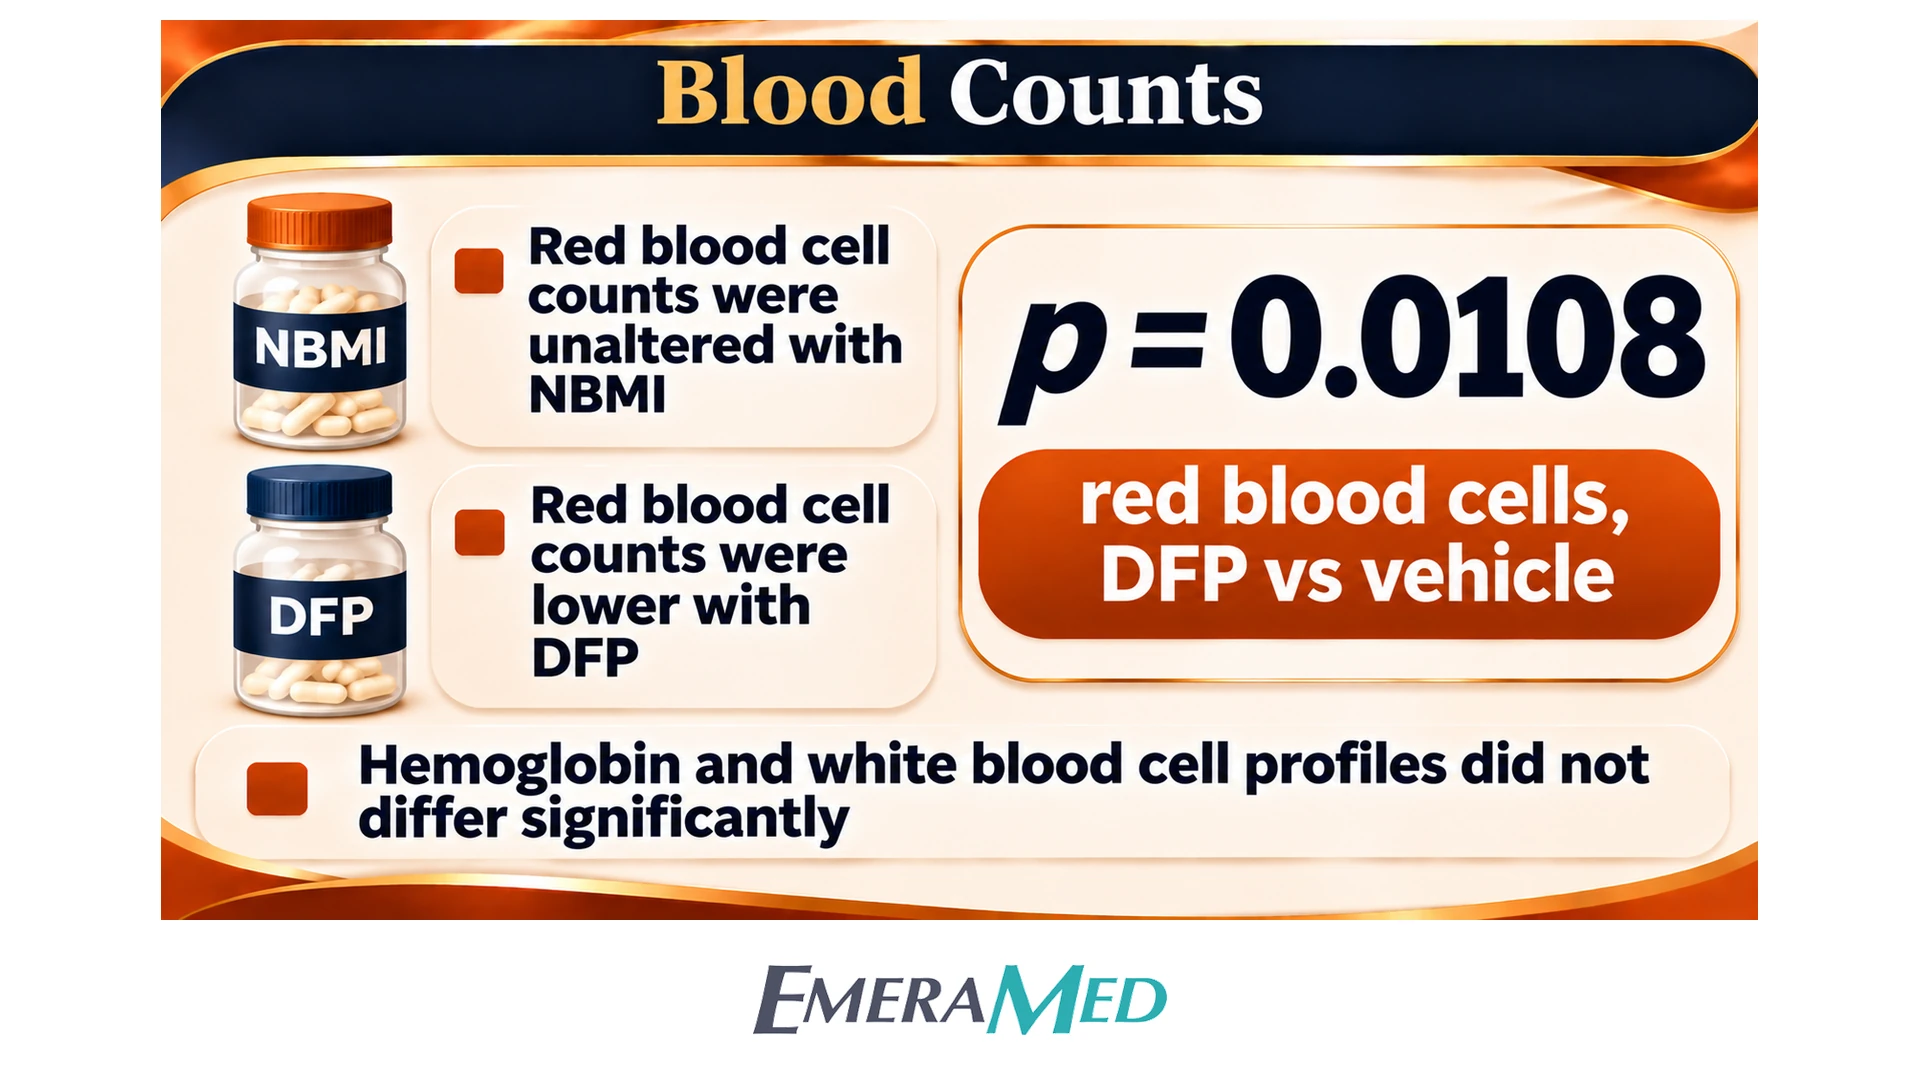
Blood counts (Figure 5). Red-blood-cell counts were not reported as significantly changed with NBMI; the DFP group had lower red-blood-cell counts (p = 0.0108). Hemoglobin did not differ significantly among groups. DFP was associated with higher mean corpuscular volume (p = 0.0031) and higher mean corpuscular hemoglobin (p = 0.0270). Mean corpuscular hemoglobin concentration did not differ significantly. Overall leukocyte profiles were not statistically significantly changed with either compound; the authors note a non-significant trend toward lower neutrophil and lymphocyte counts with DFP.
What the authors concluded
The authors concluded that NBMI bound ferrous iron in the cell-free assay, that NBMI pretreatment was associated with higher viability and lower labile iron and ROS in FAC-exposed SH-SY5Y cells, that DFP pretreatment did not show the same viability or labile-iron pattern, and that six weeks of oral NBMI in H67D mice was associated with lower liver iron, a non-significant trend in brain iron, lower brain isoprostane and lower brain copper. The DFP group showed red-cell changes that were not reported in the NBMI group. A neutral reading is that these are laboratory observations in one tumor-derived cell line and one mouse model, using unequal molar doses. The findings do not establish a clinical role for NBMI and do not show what would happen in people.
Citation
Cheng R, Gadde R, Fan Y, Kulkarni N, Shevale N, Bao K, Choi HS, Betharia S, Kim J. Archives of Toxicology. 2022. doi: 10.1007/s00204-022-03287-1. Full paper title is quoted for identification in “About the study.”